NDVI Crop Monitoring
By Jordan Gartenhaus
www.grohaus-automation.com
[quote] If we pair this phenomenon with the notion that plants strongly reflect NIR light then we can create some powerful tools to help us spot patterns that we wouldn’t otherwise be able to see.[/quote]
It’s exciting to think that despite the fact that humans have been working with plants for over 10,000 years we still have a lot to learn, especially with powerful technologies like NDVI crop monitoring; a very valuable tool for hydroponics growing.
For instance, amazingly, simple visual inspections are still the most prevalent tool people employ for detecting plant stress. This, despite the fact that human eyes can only detect a tiny fraction of the entire electromagnetic spectrum of light. Think about that for a minute. Is it possible the plants are telling us something that we as humans can’t see?
[youtube width=”560″ height=”315″ video_id=”abIs30C2kZs”]
When light comes in contact with an object, some photons are absorbed and some are reflected depending on the energy of the photon and the composition of the object’s surface. The color you perceive is a result of the photons that were reflected back to your eyes. So when you look at a healthy green leaf, you’re seeing “green” because the red and blue light is being absorbed by the pigments within the leaf, and the green light is reflected back to you.
But light is made up of much more than just the mixture of the reds, greens and blues that are perceptible to humans. The other seemingly invisible wavelengths of light seem to interact with a plant’s surface in ways that we’re only now beginning to understand.
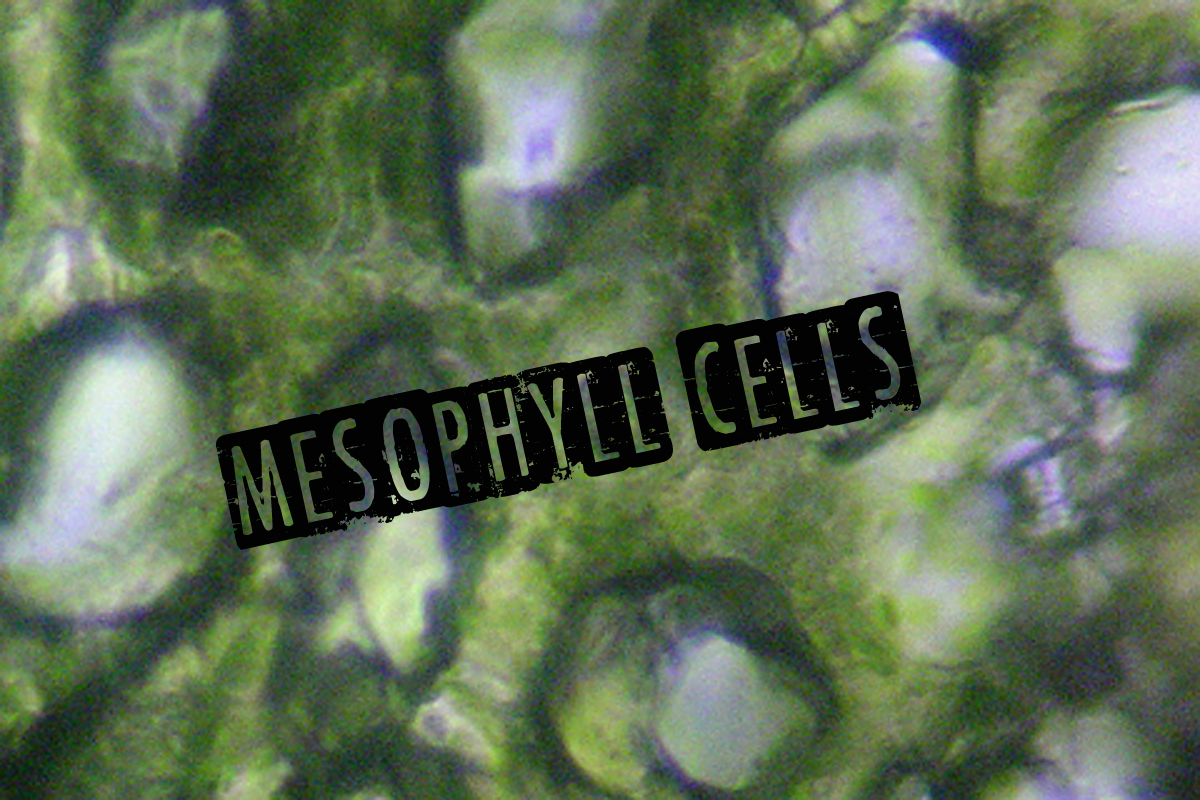
For example, plants don’t absorb near infra-red (NIR) light particularly well. When NIR light comes in contact with a leaf it will either pass right through, or it will be reflected by the spongy mesophyll cells within. Interesting to note is that the fraction of light that is reflected by the mesophyll cells strongly correlate with a plant’s general state of well-being. A healthy plant tends to have a more dense mesophyll layer and will reflect a lot of light, while a plant that isn’t doing so well will have a porous mesophyll layer that will allow a lot of light to pass through it. And as we established before, leaves look green because they’re absorbing the other visible wavelengths that we can see (i.e. red and blue) and are producing chlorophyll. If chlorophyll production were to taper off, then the absorption of light in the red and blue regions should taper off as well. After all plants don’t just store light, the electromagnetic energy is either used internally, or is reflected back.
If we pair this phenomenon with the notion that plants strongly reflect NIR light then we can create some powerful tools to help us spot patterns that we wouldn’t otherwise be able to see.
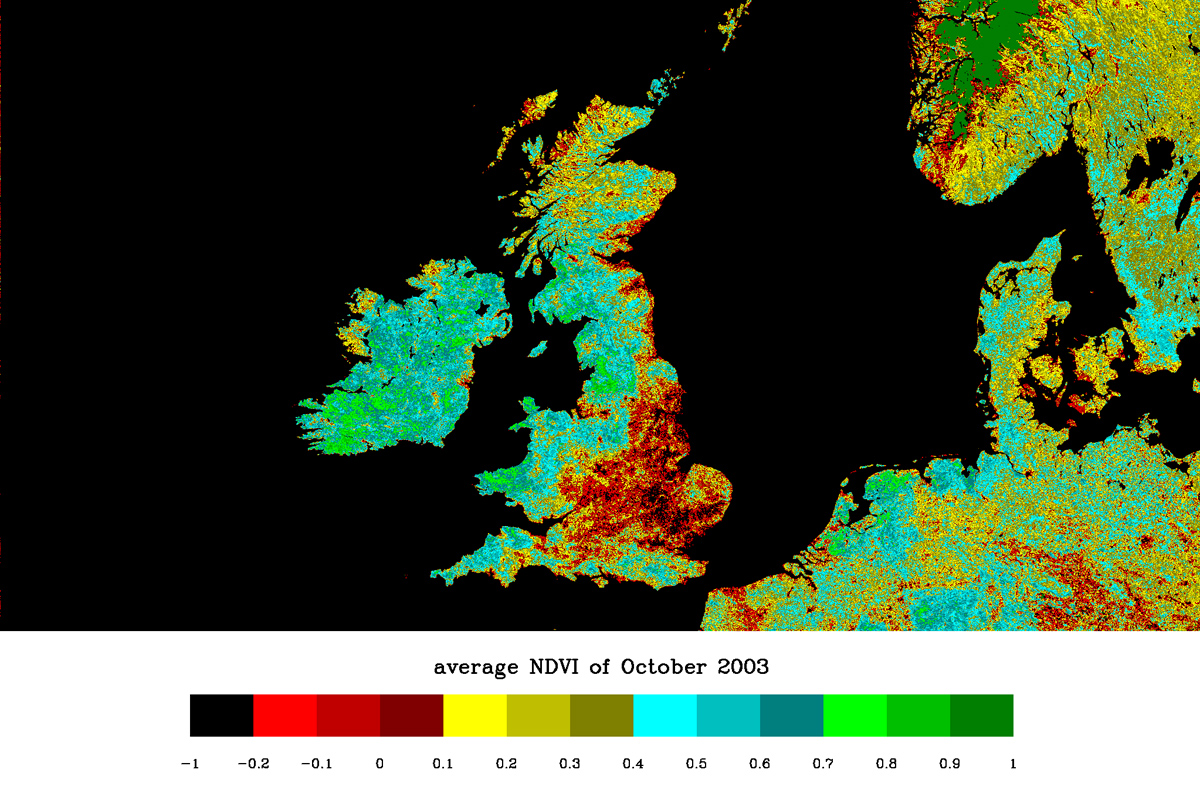
Not coincidentally, scientists have developed what they call the NDVI, or Normalized Difference Vegetation Index. It is calculated as follows:
NDVI = (NIR-Red)/(NIR+Red)
This has historically been used to identify “live plants” from “everything else” in satellite images because it does so well at identifying vegetation. It does this by comparing the amount of NIR light with and without the red wavelengths.
Since healthy plants very strongly reflect NIR light, and very strongly absorb red light, an NDVI value close to “1” would be a strong indicator of healthy plant life, and a value of “-1” would indicate something that isn’t a plant, or at least not one that’s living.
That’s great for satellite images, but what about a home garden?
Step one is sourcing the requisite equipment, but fear not. The equipment you need in order to take NIR images is surprisingly easy to come by. In fact, most digital cameras today can register infra-red light. The catch is that camera manufacturers also install filters to block infra-red out since it doesn’t contribute anything beneficial to a final image. So you can either modify your digital camera to work, or you can just pony up and buy a real infra-red camera (they aren’t too expensive anyway). Once you have your camera you can start snapping pictures.
There are some subtleties to take note of however.
First, the simplest way to go about taking these pictures is with a single camera.
If you use two cameras then the perspective will be different between the two images, which will make creating an NDVI image more challenging (that isn’t to say impossible,
however, Also, make sure to put your camera into “manual” mode if it is a point-and-shoot so it doesn’t do funny things with the aperture or shutter speed during each shot.
Once you’re ready, you need to take two pictures to create your NDVI image.
One picture should just be infra-red, and the other picture should be all visible wavelengths. If you’re good with digital image manipulation software then you can add, subtract, and divide the images in order to create your NDVI image.
If you’re not so well versed with Photoshop and the like, there are online tools and walk-throughs available to help you get started.
Now it’s time to build your database.
Just taking a series of these images isn’t going to tell you much. The value of these images is in comparing them to known examples of healthy, and unhealthy vegetation.
If you snap a picture of your crop every day and take a note about what the plants were up to you’ll notice a correlation with plant health and the NDVI. That’s because NDVI is tied so closely with photosynthetic activity.
If you take this one more step, then the tools become really powerful.
Just looking at a NDVI image can be a useful in comparing the health of a current crop to previous ones, but trends are hard to see with the naked eye.
So brilliant people have developed software that will analyze NDVI images and provide a “score” based on how much photosynthetic activity is present.
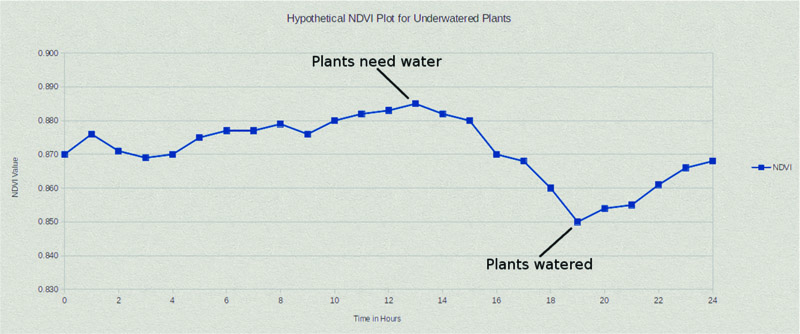
From this, you can chart the score over time and watch it rise and fall.
As before, you will start to see a pattern emerge as the NDVI values vary naturally as the plant matures. But you will also undoubtedly see trends emerge when the plants encounter what they perceive to be stressful conditions.
You’ll notice a sharp drop in photosynthetic activity, and if it’s unexpected then there’s a strong possibility that your crop’s in trouble.
Although this technology is far from mature, it’s also arguably underutilized.
The cost of equipment required to generate a real NDVI plot is reasonable, and the software required in order to analyze the NDVI images is available with a Google search.
The only real hurdle in utilizing this technology is in building your own database of NDVI images.
But, if your crops are consistent and you don’t mind tinkering a bit then this could be an incredibly powerful tool for your tool box.